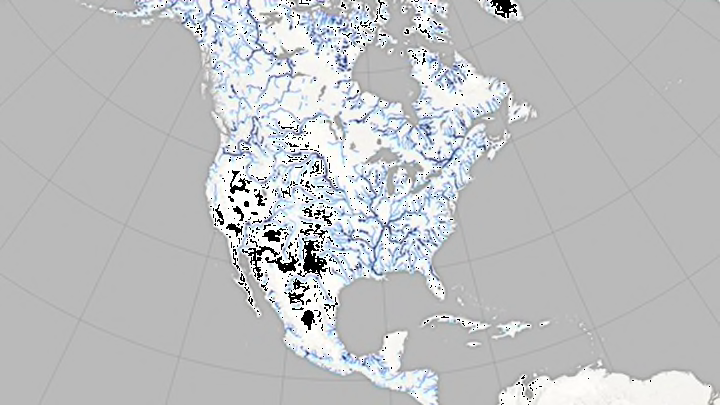
Fancy New Maps Show the Width of North America's Rivers

There’s a fair amount we don’t know about the world’s rivers, including how wide they are. Typically, estimates of river widths are calculated through a painstaking process of measuring water flow at different points and carefully examining topographic maps. Satellite images, however, make the process a whole lot easier, resulting in a much more accurate map of what North America’s waterways look like.
As part of a study published in Geophysical Research Letters, researchers at the University of North Carolina Chapel Hill combed through more than 1700 images of Earth taken by the Landsat satellites run by NASA and the U.S. Geological Survey. These images—all with limited cloud cover and no ice covering the rivers, taken at different times of the year when they were at their highest points—were run through a software program that pinpointed the centers and edges of all the rivers.
Image Credit: George Allen
In the resulting image (top), river width is noted with shades of blue—the darker the line, the wider the river. The dryness of the American Southwest and Mexico stands out; meanwhile, Alaska is home to a swath of vast waterways. You can easily pick out the dark blue of the Missouri and Mississippi Rivers. Another image (above) provides an even more granular look, putting water width on a color spectrum to differentiate between super-thin waterways and medium-sized rivers.
Estimating the width of rivers is necessary for evaluating flood hazards, studying ecology, and estimating the greenhouse gases rivers emit due to bacteria. The researchers plan on releasing river width data for the entire world around 2016.
[h/t: Wired]